About me
Project Manager and Test Manager in previous life
Self taught in R and worked as a Data Scientist
Enspiral Dev Academy
Full Stack Engineer in the Xero Ecosystem (Sept 2020 - Mar 2022)
Data Platform Engineer in the Xero Data Team (Mar 2022+)
Community meetup organiser
About this talk
Disclaimer: This talk is about a data visualisation personal project, not related to work at XeroThis story started in New Zealand
Draggable globe made with D3.js in Observable (by Kim Fitter)
A trip to St John's Observatory in January 2019

I then used open source data to write a blog and create a map of
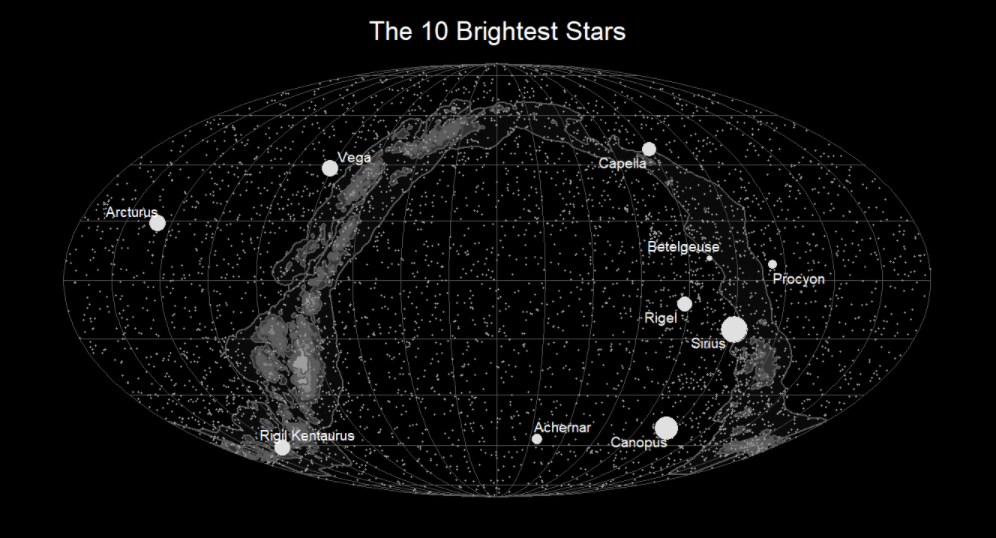 Map made in R using D3-Celestial data (by Kim Fitter)
The blog post was also repurposed by someone else
#30DayChartChallenge | Day 14 | Space
— Jake Kaupp (@jakekaupp) April 14, 2021
I wanted to do the brightest stars in a map, but had no idea where to start. Found a blog post by @Kim_Fitter that was just what I wanted.
Code @ https://t.co/H0RsYGnw5E #rstats #r4ds #dataviz pic.twitter.com/S9FhOA8cEA
In 2021 I returned to the D3-Celestial dataset with other tools
D3.js - Data Driven Documents Vega-Lite.js - A Grammar of Interactive GraphicsVisualising the apparent magnitude property using D3.js
Analysing the magnitude using Vega-Lite.js
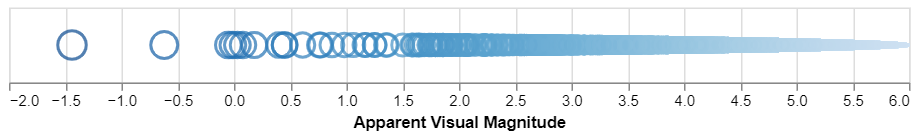
The dimmer the star, the higher the apparent magnitude (m) number
The brightest star, Sirius has m = -1.44
Which is almost 2 magnitudes brighter than Vega (m = 0)
Where 1m: brightness factor of 2.512
Analysing the color using Vega-Lite.js
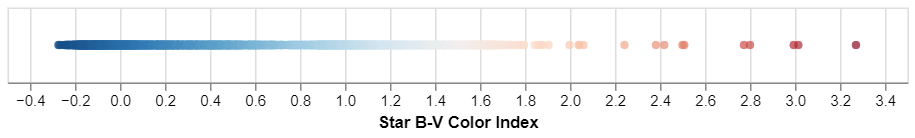
Hot stars (low B-V) are blue/purple and cool stars (high B-V) are red
Where B-V is difference in blue (B) and visual (V) filters
What have I learnt from visualising star data?
Be curious about data when learning code
Try new tools, but don't hold on too tight
.....challenge your assumptions about the data
.....analyse your data
.....define the meta data
Connect with others and share your knowledge
Question
How could you use data to build your products and applications?
How I made these slides
Select JS libraries for slides based on a blog post - reveal.js + vite.js
Customise CSS based on a Twitter post
Cheers Steve, although the styling credit really has to go to the creators of the amazing Terminal CSS theme! https://t.co/oIRUVFZxdk I've just been gradually adding new components to suit the needs of my site but trying hard to keep the original concept.
— Jeffrey Knox (@jeff_r_knox) August 14, 2021
References
How to set up local HTML presentations using Reveal.js engine bundled by Vite.jsCelestial Maps blog - Kim Fitter
Introduction to Vega-Lite
What is stellar magnitude?
Observable JavaScript data analysis and maps - Kim Fitter
Thanks
https://connected-stars.netlify.app/@Kim_Fitter